OEE (Overall Equipment Effectiveness) helps you answer one practical question for a specific production line: How effectively is this line running in the period we are measuring right now?
"Right now" usually means the current or most recently completed shift, batch, or production run - not a vague monthly average. OEE is always calculated for a defined window (one line, one time period, one consistent unit of measure).
Even if you are new to manufacturing KPIs, you can break it down into three easy parts.
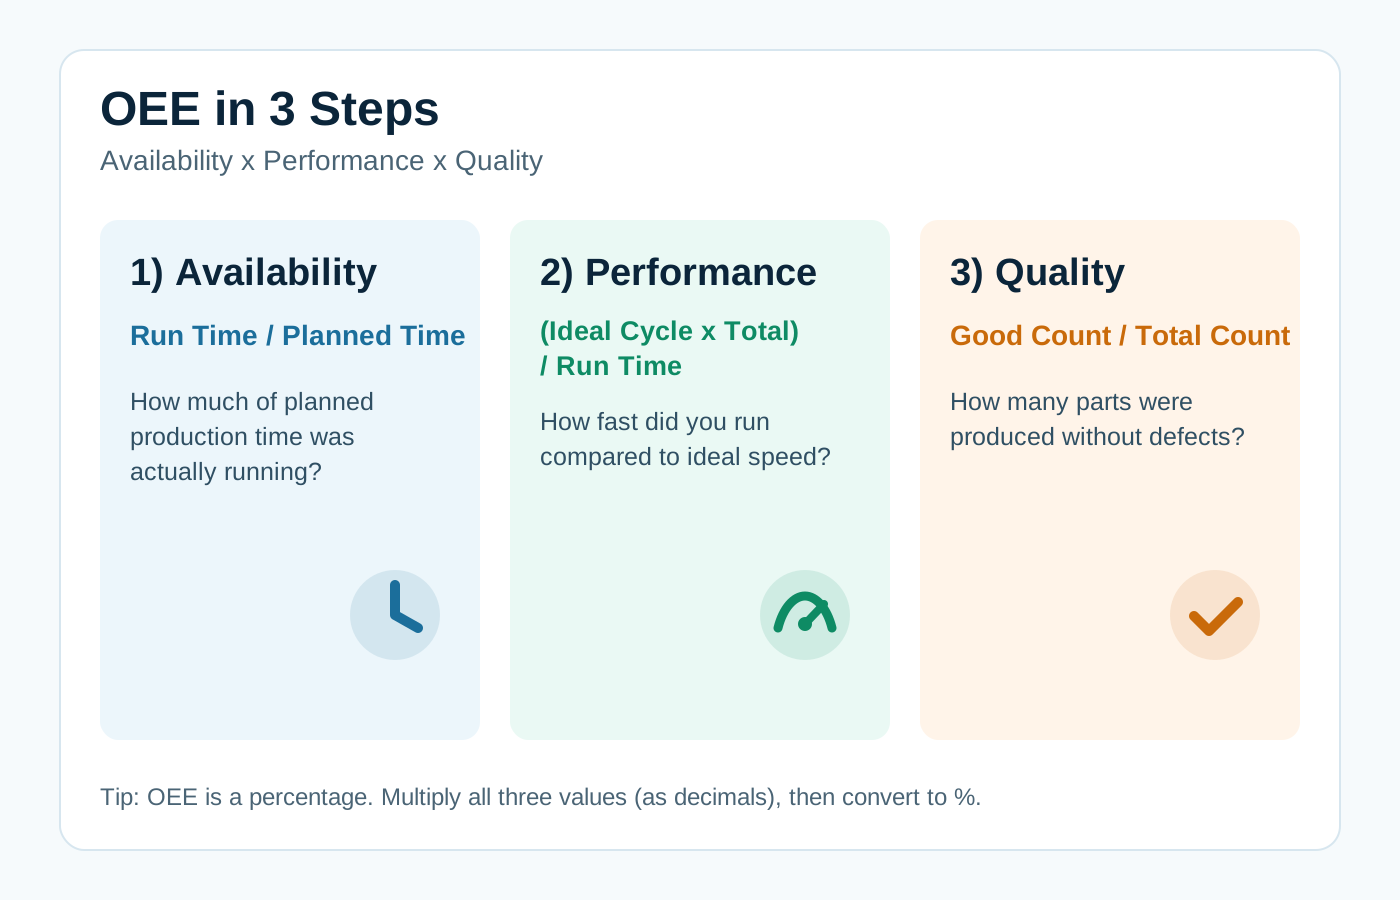
The core formula is straightforward: OEE = Availability x Performance x Quality.
1) Availability checks how much planned production time was actually used for running (not lost to downtime).
2) Performance checks whether the process ran at the ideal speed for the output actually produced in that period.
3) Quality checks how much of that output was good, not scrap or rework.
What does "total" mean in Performance?
In Performance = (Ideal Cycle Time x Total Count) / Run Time, the word Total Count means the total units actually produced in the measurement period - parts, kilograms, liters, or whatever unit your line uses.
It is not your sales forecast, not your committed delivery volume, and not "good parts only." It is everything you produced in that window before Quality adjusts for scrap. If you produced 800 units in 14 hours of run time and your ideal cycle time is 1 minute per unit, Performance compares that real output against what the line could have made at ideal speed in those 14 hours.
If you understand these three ratios and agree on definitions, OEE is no longer intimidating.
How often should you measure OEE?
There is no single "correct" interval - it depends on what decision you need to make:
- Per shift is best for daily operations: stand-ups, handovers, and immediate actions on the line.
- Per day is best for trends and management reporting when the same line runs similar products.
- Per batch, order, or SKU run is best when the line changes product often, setup times differ, or ideal cycle time changes between products.
Use the same input definitions in every period. If you compare Monday to Tuesday, both days must use the same rules for planned downtime, scrap, and ideal cycle time.
Multiple products on one line (different setup times)
When one line runs several products, a single daily OEE number can hide the real story. A more useful approach:
- Calculate OEE per production run (from setup to setup, or per SKU), with an ideal cycle time per product.
- Treat planned changeovers/setup as planned downtime; track unplanned stops separately.
- Roll up to shift or day only when you need a summary, ideally weighted by run time - not as a simple average of OEE percentages.
That way a long changeover on Product B does not silently look like "low Availability" for Product A.
Quality on continuous production (e.g. milk processing)
Good Count / Total Count still applies when you do not count discrete parts. Define your unit clearly:
- Total Count = total volume or mass produced in the period (liters, kg, tons).
- Good Count = volume that meets specification and moves to the next step (not diverted to waste, rework, or off-spec tanks).
Use flow meters, tank balances, or QC sampling converted to volume - whatever matches how your plant records loss. The formula stays the same; only the unit changes from "parts" to "liters" or "kg."
Who defines ideal speed - the machine, the crew, or the plan?
Ideal cycle time should reflect the technical optimum for that product on that line (engineering standard, OEM capability, or proven best stable run) - not today's staffing level and not your commercial delivery commitment.
If you only have two operators and that permanently caps throughput, that is a real performance loss - but it should be visible as a constraint, not baked into a lowered "ideal" forever. Committed volume belongs in planning and delivery KPIs; ideal cycle time belongs in equipment and process capability.
Here is a simple example that mirrors the type of fields teams often enter in OEE forms:
- shift time,
- planned downtime,
- run time,
- ideal cycle time,
- total produced parts,
- total scrap.
Now use the following values:
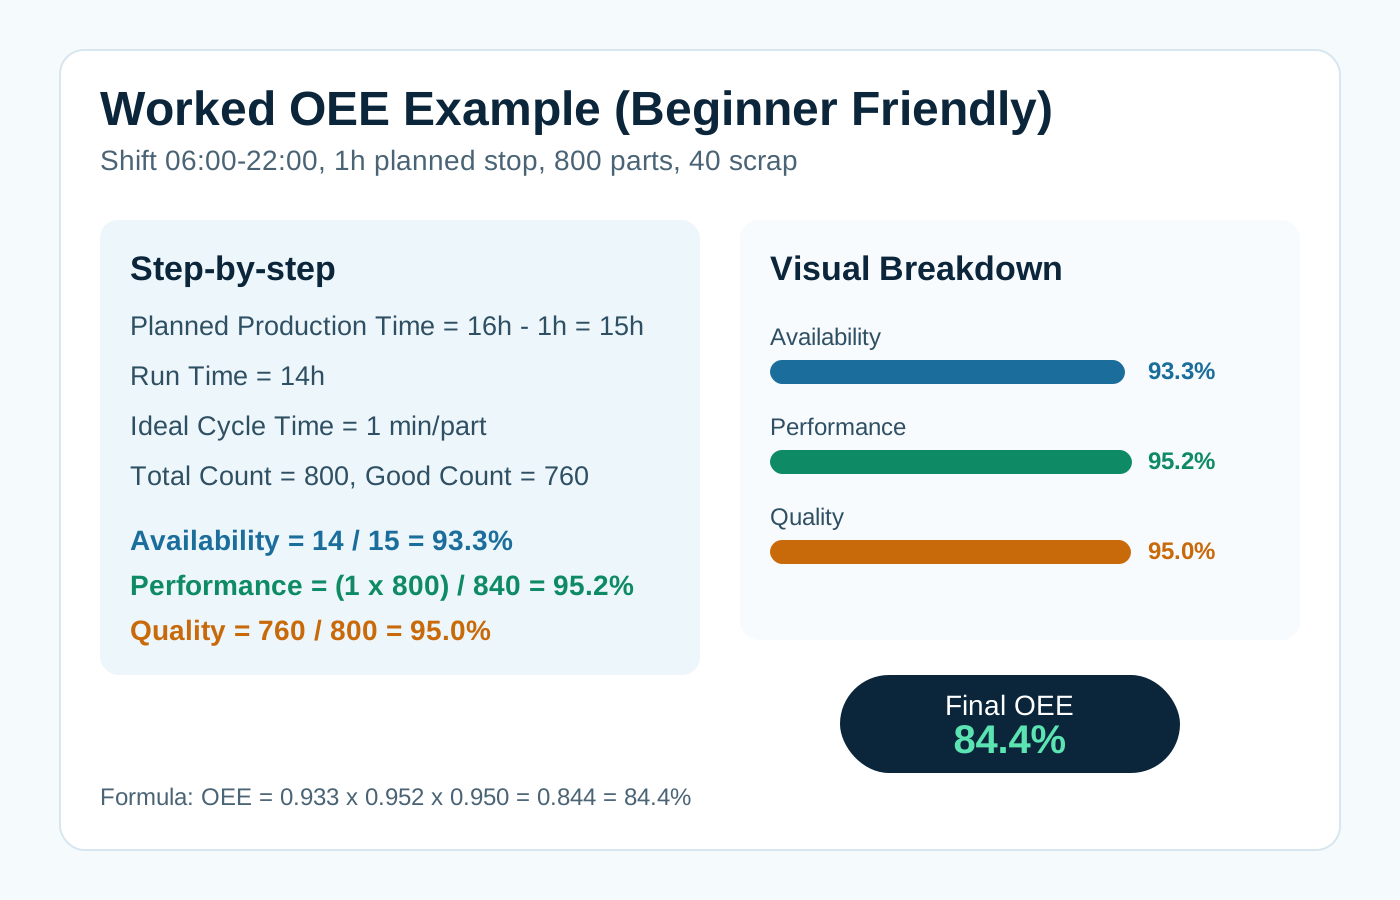
- Shift: 06:00-22:00 (16h total),
- Planned downtime: 1h,
- Run time: 14h,
- Ideal cycle time: 1 minute per part,
- Total count: 800 parts,
- Scrap: 40 parts.
From this, calculate each component:
- Availability = 14 / 15 = 93.3%,
- Performance = (1 x 800) / (14 x 60) = 95.2%,
- Quality = 760 / 800 = 95.0%.
Then combine all three:
- OEE = 0.933 x 0.952 x 0.950 = 0.844 = 84.4%.
How to read the final OEE number quickly:
- 100% means perfect production (rare in real operations),
- 85% is often considered world-class in stable environments,
- lower values usually signal losses in one of the three components.
That is why OEE should not be treated as a single score. The real value comes from seeing where losses happen first (time, speed, or quality) and improving that specific part.
If your team is collecting machine data already, OEE can become a daily operating tool, not just a monthly report KPI.
Try it with your own numbers: enter shift time, downtime, run time, ideal cycle time, output, and scrap in the Predsense workflow and see OEE update from your inputs: https://www.predsense.ai/products/anomaly-detection