Most plants do not lack data. They lack the few numbers that actually explain how the operation is performing right now. The right manufacturing KPIs cut through the noise and turn a busy shop floor into a clear, shared story.
Here are the seven KPIs every operations manager should track - and, just as important, how to make them work together instead of in isolation.
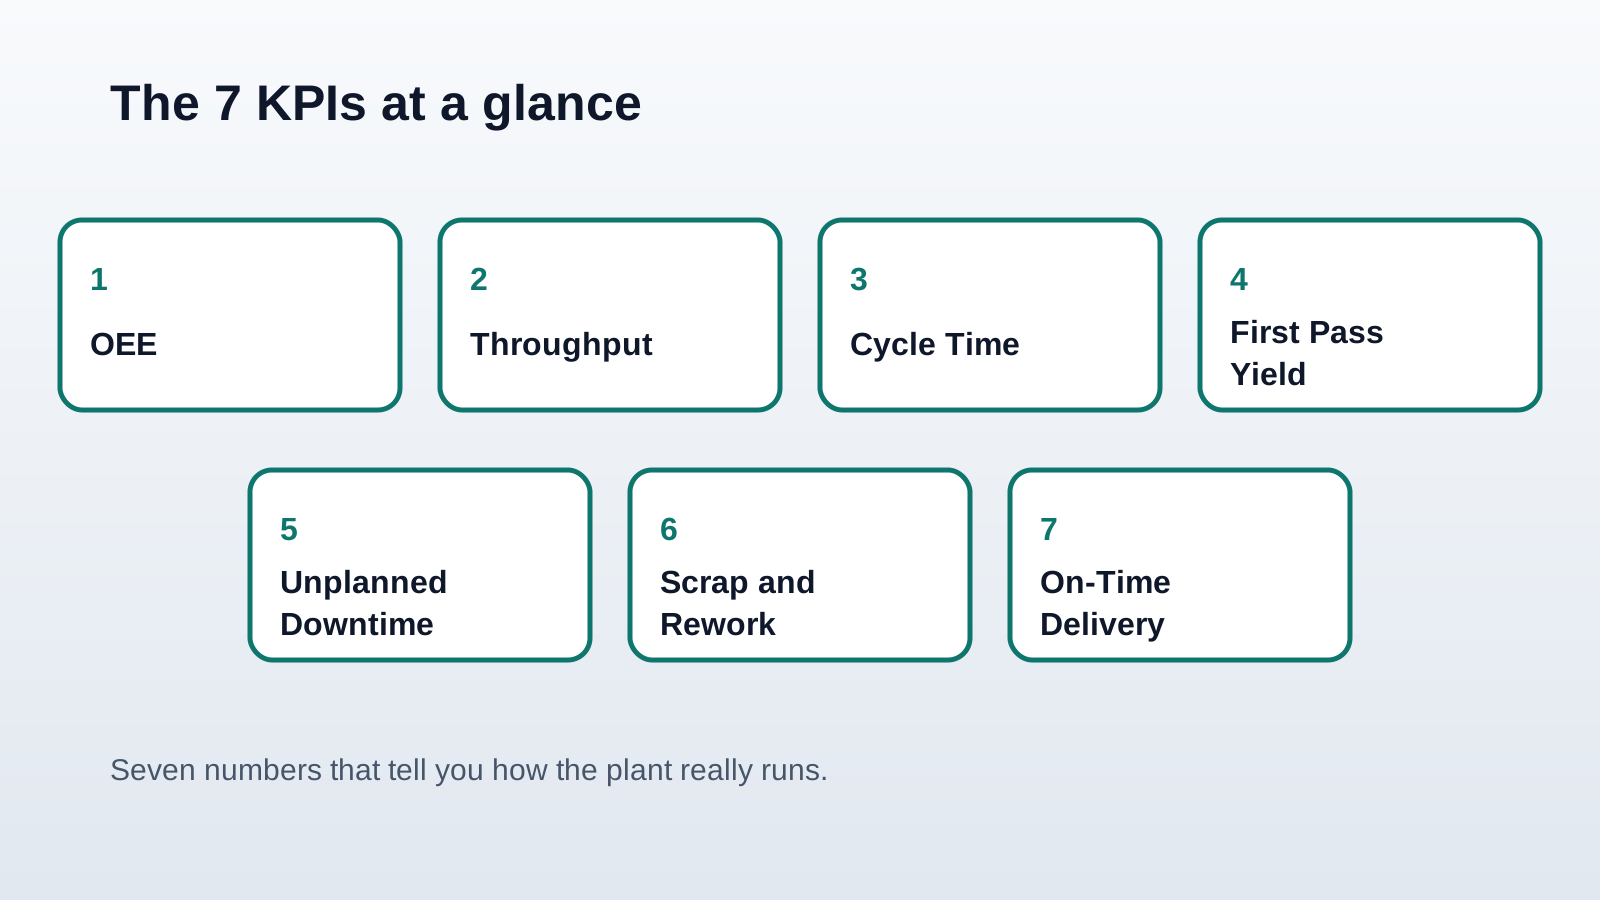
1. Overall Equipment Effectiveness (OEE)
OEE combines availability, performance, and quality into one score. It is the single best starting point because it shows how much of your theoretical capacity you actually convert into good output. Track it per line and per shift, not just plant-wide.
2. Throughput
Throughput is the volume of good units produced over a period. It connects the shop floor to the business: if throughput drops, revenue and delivery promises are at risk. Watch it against demand, not in a vacuum.
3. Cycle Time
Cycle time is how long it takes to produce one unit, end to end. Rising cycle time is often the earliest sign of a developing problem - tooling wear, material variation, or a bottleneck shifting between stations.
4. First Pass Yield (FPY)
FPY is the share of units made correctly the first time, without rework. It is a brutally honest quality metric: high throughput with low FPY just means you are producing scrap and rework faster.
5. Unplanned Downtime
Unplanned downtime - and its companions MTBF (mean time between failures) and MTTR (mean time to repair) - reveal reliability. The goal is not only less downtime, but earlier warning before a stop happens at all.
6. Scrap and Rework Rate
Scrap and rework quantify wasted material, time, and capacity. They are where quality problems turn into direct cost. Trend them by product and by root cause, not as a single plant average.
7. On-Time Delivery (OTD)
OTD measures whether you keep your promises to customers. It is the KPI leadership and clients feel most directly, and it is downstream of everything above - which is why it should never be tracked alone.
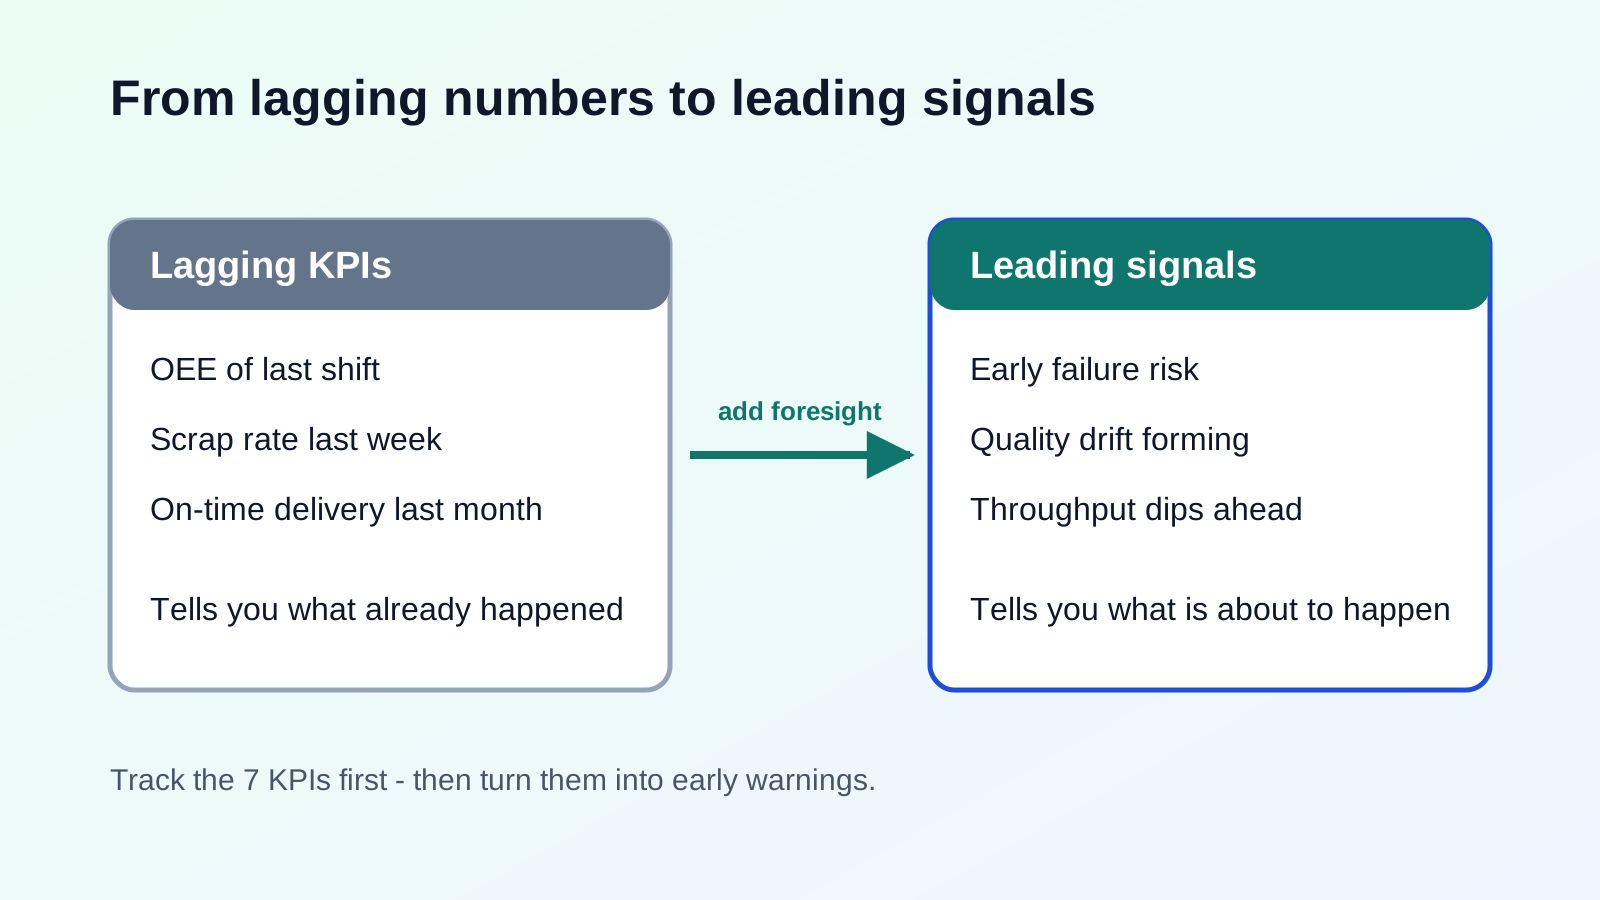
Lagging KPIs are necessary, but not enough.
Most of these metrics describe what already happened. They are essential for accountability, but on their own they keep teams reacting. The real advantage comes when you connect them to leading signals - early patterns that predict where OEE, yield, or downtime are heading next.
How to make your KPIs predictive.
Start by tracking these seven consistently and at the right granularity (line, shift, product). Then add context: link each KPI to the underlying time-series signals from machines and processes. Once the data tells a connected story, the same KPIs that explained yesterday can warn you about tomorrow.
That is the shift from reporting to foresight - measure clearly, benchmark honestly, and act earlier.
See how Predsense turns operational data and KPIs into predictive foresight: https://www.predsense.ai/