Leadership approves predictive maintenance when the business case is clear. Too often, ROI slides use vague "efficiency gains" without tying numbers to downtime, maintenance spend, and quality. A credible maintenance ROI calculator starts with operational math your plant already understands.
What period and scope should you use?
Calculate ROI for one critical line or asset class first, not the whole plant on day one. Use a monthly or quarterly window aligned to how you already report downtime and maintenance spend. Set a 90-day baseline before the pilot with the same rules you will use during the pilot (planned vs unplanned stops, loaded cost assumptions).
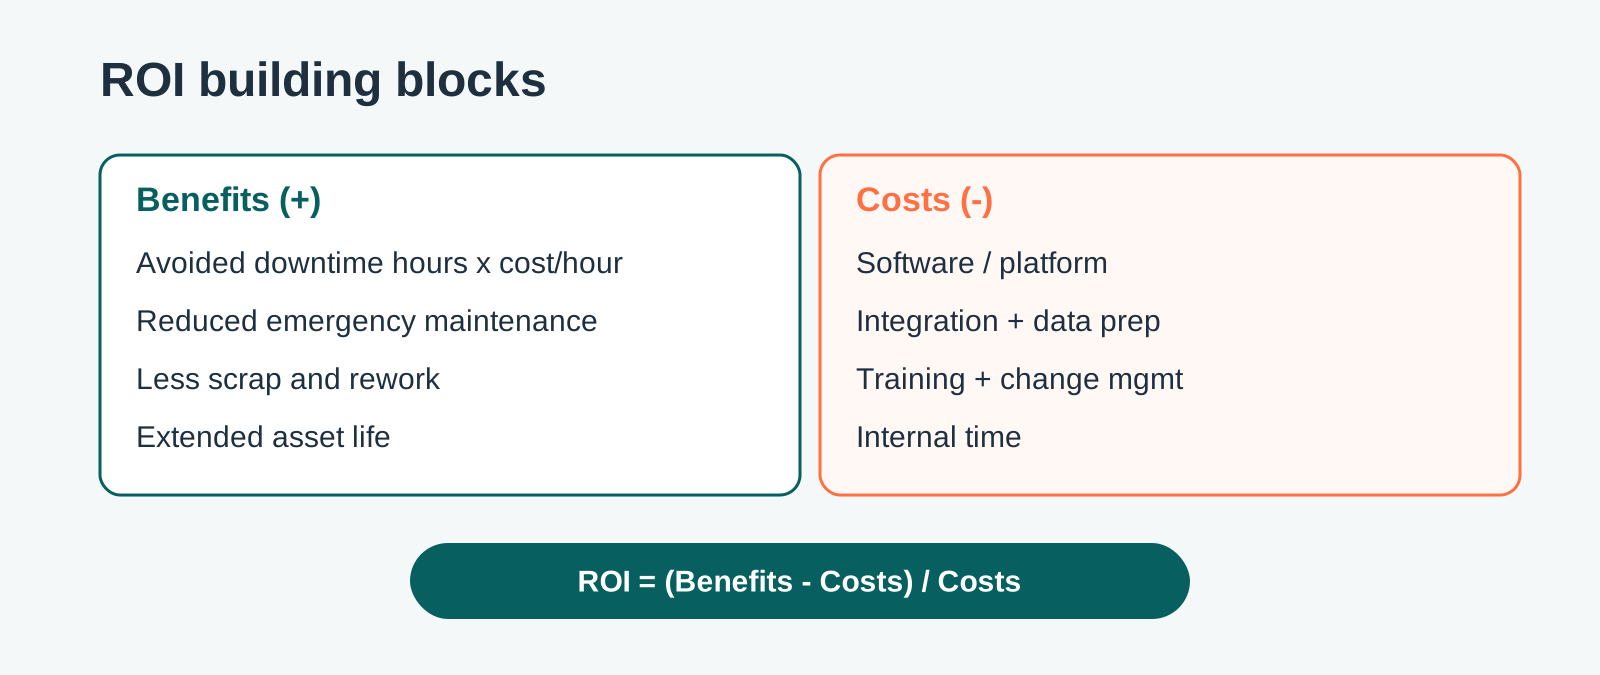
The core ROI formula
ROI = (Total benefits - Total program cost) / Total program cost
Express as a percentage for comparison across initiatives. For payback period, divide program cost by monthly net benefit.
Fully loaded cost per hour means lost production value plus labor, overhead, and typical secondary impacts you would count in a downtime business case - not wrench time alone. Use the same loaded rate you would use for unplanned downtime on that line.
Avoided means a documented event you prevented or shortened (timestamped alert, planned intervention, no hard stop) - not a vague correlation.
Benefits to include (be conservative)
- Avoided downtime: prevented hours x fully loaded cost per hour (production value + labor/overhead, not just repair labor)
- Reduced emergency maintenance: fewer after-hours callouts, less firefighting, lower contractor premiums
- Less scrap and rework: quality losses tied to unstable equipment or process drift
- Extended asset life: deferring major replacements when risk is managed earlier
- Lower energy waste: equipment running inefficiently before hard failure
Costs to include (do not hide them)
- Software/platform subscription or license
- Integration, data preparation, and annotation effort
- Training and change management
- Internal engineering time for pilot and rollout
- Any incremental sensor or connectivity work (if required)
Worked example (illustrative)
One bottleneck line, one month:
Benefits
- Avoided downtime: 4 hours x EUR 25,000/h loaded = EUR 100,000
- Less emergency maintenance and scrap (conservative) = EUR 15,000
- Total benefits = EUR 115,000
Program cost (all-in)
- Platform, integration, and internal time = EUR 40,000
Result
- Net benefit = 115,000 - 40,000 = EUR 75,000/month
- ROI = 75,000 / 40,000 = 187%
- Payback on this line: about 0.5 months of net benefit
Real plants vary widely. The point is to use your numbers, not industry averages alone.
Pilot-first ROI discipline
Prove ROI on one line or asset class before scaling:
- Define baseline downtime and maintenance KPIs for 90 days pre-pilot
- Run pilot 90-180 days with clear success thresholds
- Document avoided events with timestamps and cost assumptions
- Expand only when net benefit exceeds agreed hurdle rate

Common ROI mistakes
- Counting only repair labor, ignoring lost production value
- Ignoring partial outages and speed losses (not just full stops)
- Omitting internal implementation cost
- Scaling before validating alert quality and action rates
Partial stops and speed loss
If alerts help you catch a problem before a full stop, count avoided hours honestly - a 2-hour partial outage prevented is still 2 hours of loaded cost. Speed losses without a stop are harder; include them only when you can tie drift to measurable output or quality loss.
How to read the final ROI number
- Under 0% = costs exceed documented benefits on that scope
- 0-50% = positive, but may need a longer pilot or tighter scope
- 50%+ on a validated pilot line = strong signal to document assumptions and plan expansion
- Compare ROI only when scope, period, and cost assumptions match
When ROI is hardest
Highly intermittent failures, no baseline data, or teams that cannot act on alerts. Fix operability first; ROI follows when warnings convert to prevented events.
Build your maintenance ROI case with transparent assumptions, then tighten them with pilot data.
Try it on one line: document avoided events, labels, and pilot outcomes in Predsense labeling and build your ROI case from traceable inputs: https://www.predsense.ai/products/labeling